- Click here for the article.
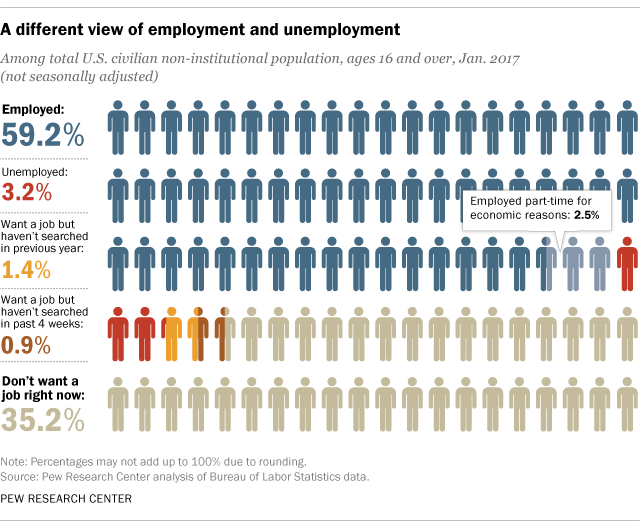
Every month, the federal Bureau of Labor Statistics releases a flood of data about employment and unemployment in the U.S. And every month, the lion’s share of the attention goes to one figure – the unemployment rate, which was a seasonally adjusted 4.8% in January. (The February report comes out on Friday.)
But the unemployment rate is just one indicator of how the U.S. economy is doing, and it’s not always the best one. Simply being out of work isn’t enough for a person to be counted as unemployed; he or she also has to be available to work and actively looking for work (or on temporary layoff). In any given month, the unemployment rate can rise or fall based not just on how many people find or lose jobs, but on how many join or leave the active labor force.
There are, in fact, five other monthly measures of what the BLS calls “labor underutilization” besides the official unemployment rate, as well as scores of other measurements – labor force participation rates, employment-population ratios, average weekly wages, average hours worked and more. Knowing what those other data points are, where they come from and how they’re calculated is critical in understanding what they do – and don’t – tell us about the nation’s workers.
