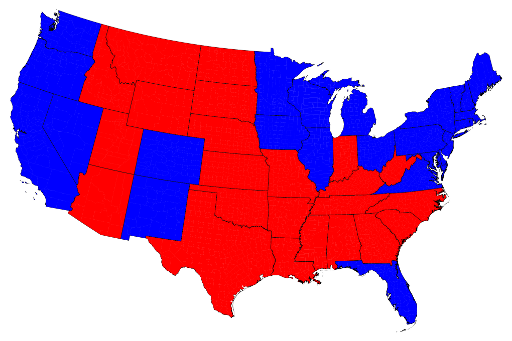
This shows which states voted Democrat (Blue) and Republican (Red) in 2012:
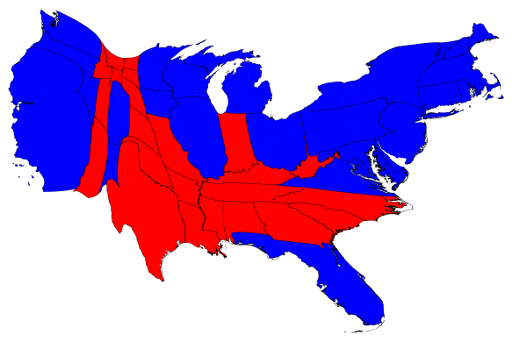
Here are the states adjusted by population:
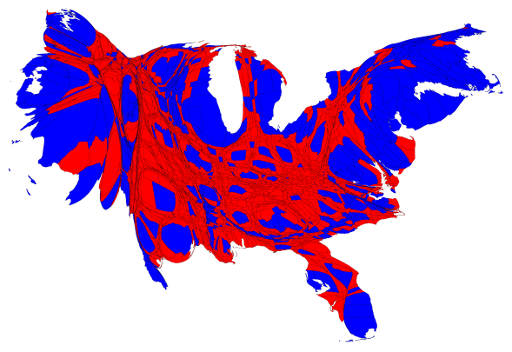
And for good measure, here are the red and blue counties, as of the 2012 election:

And the counties also adjusted by size:
For background on the whole red/blue distinction, click here.